- Qualifi Level 7 Diploma Unit EDML708 Research Methods for Childhood, Education and Family Support (D/650/6688) Assignment Brief 2026
- Qualifi Level 7 Diploma Unit EDML707 Postgraduate Study of Childhood, Education and Family Support (A/650/6687) Assignment Brief 2026
- IMA7001 International Marketing Management Assessment 1 Brief 2026 | RCL
- Qualifi Level 7 Diploma Unit EDML706 Research Methods in Education (F/618/3140) Assignment Brief 2026
- Qualifi Level 7 Diploma Unit EDML705 Leading Reflective Practice in Education (L/618/3139) Assignment Brief 2026
- Qualifi Level 7 Diploma Unit EDML704 Pedagogy and Practice in Education (J/618/3138) Assignment Brief 2026
- Qualifi Level 7 Diploma Unit EDML703 Managing Change in an Education Context (F/618/3137) Assignment Brief 2026
- Qualifi Level 7 Diploma Unit EDML702 Contemporary Issues in Education: Theory, Policy and Practice (A/618/3136) Assignment Brief 2026
- Qualifi Level 7 Diploma Unit EDML701 Leadership Qualities and Practice in Education (T/618/3135) Assignment Brief 2026
- Qualifi Level 7 Diploma Unit CPD703 Effective Communication through CPD (K/617/7493) Assignment Brief
- Qualifi Level 7 Unit CPD701 Contemporary Issues Underpinning Leadership in CPD (D/617/7491) Assignment Brief 2026
- Qualifi Level 7 Diploma Unit CPD702 Developing Research and CPD (H/617/7492) Assignment Brief
- QUALIFI Level 6 Diploma Unit 1 Principles of Teaching and Learning Theory and Practice (Y/618/5461) Assignment Brief 2026
- HCR7013 Contemporary Challenges in Public Health Assessment Brief 2026 | Arden University
- BTEC HND Unit 41 Database Management Systems Assignment Brief 2026
- MKT744 / MKT77216 Global Marketing and Sales Development Assignment Brief 2026 | Ulster University
- NURS 1584 Introduction to Preparation for Professional Practice Assessment Brief 2026 | UOG
- SH4011 Research and Academic Practice Assessment brief 2026 | LMU
- IMA7007 HR in Global Context Assessment Brief 2026 | University of Greater Manchester
- Qualifi Level 7 Unit 712 Human Resource Planning Assignment Brief 2026
The Excel sheet uses data from the control group (30g glucose drink), a “cornflakes group” and an “All Bran group”: Nutrition Assignment, LHU, UK
| University | Liverpool Hope University (LHU) |
| Subject | Nutrition |
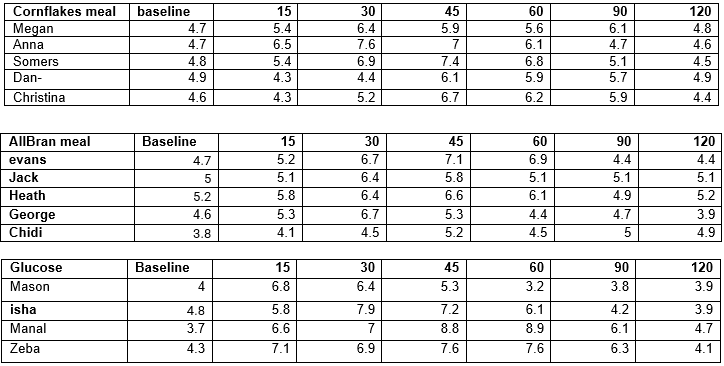
Q1. The Excel sheet uses data from the control group (30g glucose drink), a “cornflakes group” and an “All Bran group”. In the space below, draw a figure showing the time course for the changes in glucose concentration in the three groups. This figure should include an estimate of variability (SEM or SD) and a figure legend
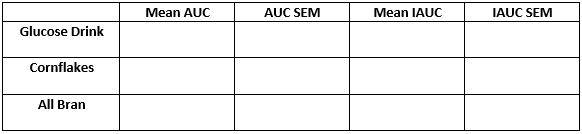
Q2. Using Excel, calculate the mean and SEM for the AUC and the IAUC for the glucose, cornflakes, and all bran groups.
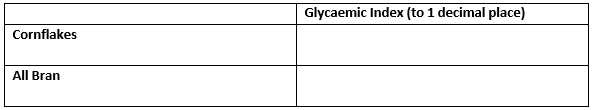
Q3. Based on your data in question 2, calculate the Glycaemic Index of both cornflakes and All bran using the AUC.
Do You Need Assignment of This Question
Are you struggling to keep up with your academic workload? Do you find it difficult to complete your essays and assignments on time? Look no further than studentsassignmenthelp.co.uk! We offer top-quality essay writing help that is tailored to meet your unique needs and requirements. Our team of experienced writers are dedicated to delivering high-quality, original work that is guaranteed to earn you top grades. Whether you need help with research, writing, or editing, our assignment experts are here to assist you every step of the way. Plus, with our affordable pricing and 24/7 support, you can rest assured that you are getting the best value for your money. So why wait? Contact us today to get started on your path to academic success!
Answer


