- EN7068 Leadership, Stakeholders and Data Analytics Coursework Brief 2026
- ENGE2003 Engineering Project Management Coursework 2, 2026 | DMU
- 55-500223 Analogue and Digital Electronic Design Coursework Brief 2026 | SHU
- EGR9017 Power Systems Assessment Coursework 1 Brief 2026 | University of Lincoln
- 7BIOM037W Systems Biology Coursework 1 Report 2026 | University of Westminster
- NCFE CACHE Level 3 Unit 8 Professional Practice Portfolio 1 Coursework 2026
- NCFE CACHE Level 3 Unit 9 Supporting Emergent literacy Coursework 2026
- 6WBS0035/ 6WBS0036 Digital Economy CW1 Assignment Brief 2026 | UOH
- DSM060 Data Science Research Topics Coursework Assignment 2026 | UOL
- BARC0087 Structures Materials & Forming Techniques Coursework 2026 | UCL
- LL5306 Commercial Law Assessment Coursework Brief 2026 | Kingston University
- M22319 / M33098 Numerical Skills & Economics Assessment Coursework | UOP
- BMG872 Global Strategy Development and Implementation Individual Assignment CWK Brief 2026
- LLB020N204A Law of Property Assessment Coursework Brief 2026
- BS3397 Microeconometrics Coursework Assignment Brief 2026 | AU
- UMAD47-15-M Managing Finance Assessment Coursework Brief | UWE
- BST851 Business Data Analytics Assessment Coursework 2026
- MMM143 International Business and the World Economy Coursework 2026
- EMS402U Engineering Design Coursework Project Report 2026 | QMUL
- 25BSC565 Fundamentals of Strategic Management Coursework Brief
Figure 1 shows a tower crane with the properties listed in Table 1. The distance between the trolley and mast: Statics and Dynamics Course Work, NUN, UK
| University | Northumbria University (NU) |
| Subject | Statics and Dynamics |
Question 1
Figure 1 shows a tower crane with the properties listed in Table 1. The distance between the trolley and mast x can change from 0 to dj (Figures 1 and 2).
Table 1: Specifications of the tower crane
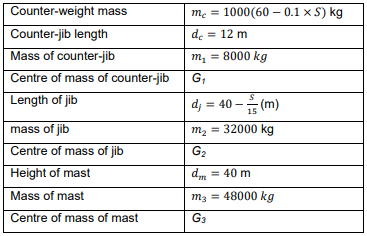
- Draw the free body diagram of the tower crane and calculate the reactions at O when the mass of the lifted body 𝑚 = 5000 𝑘𝑔 and the distance 𝑥 = 20 m
- When 𝑚 = 5000 kg, find and plot the moment at O as a function of 𝑥, and determine the value of 𝑥 when the moment at O is zero
- If the magnitude of the maximum moment at O is 2,500 kN∙m and the magnitude of the maximum force at O is 1,650 KN, calculate the maximum mass of the body that the tower crane can lift regardless of the trolley location.
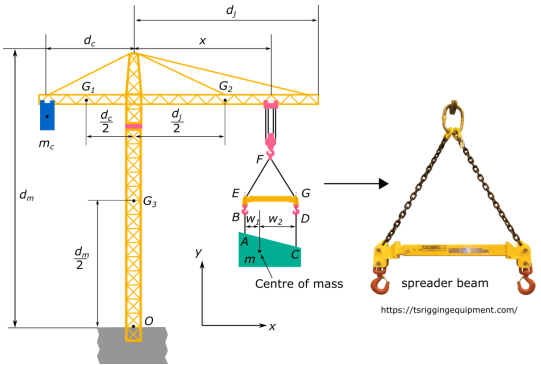
- When lifting heavy bodies with two points is required, a spreader beam is used (Figure 3). If 𝑤₁ = 0.7 m, 𝑤₂ = 1.4 m, 𝑚 = 1000 × (5 − 0.010 × 𝑆) 𝑘𝑔, and the mass of the spreader is negligible:
1. Calculate the tension forces in the slings AB and CD when the lifted body is not tilted
2. To prevent the body from tilting, what should be considered in the design and operation of the spreader beam?
Buy Answer of This Assessment & Raise Your Grades
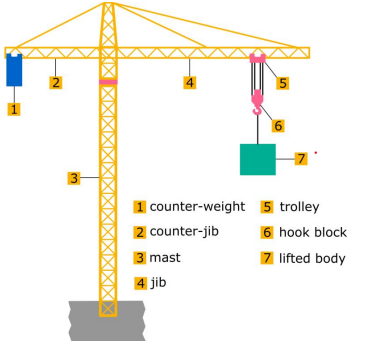
Figure 1: its model
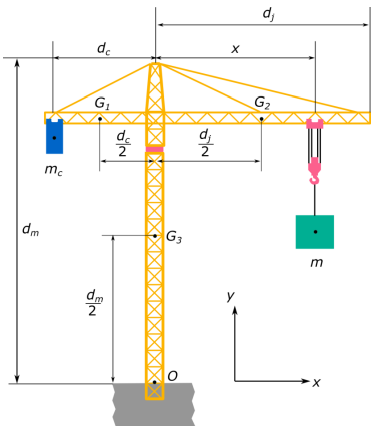
Figure 2: Tower crane specifications
Question 2
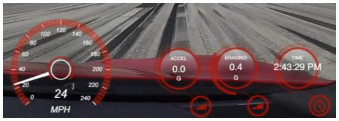
The car acceleration time history for 62 seconds (i.e., between 2:42:27 pm and 2:43:29 pm) is shown in figure 4. During this time, the car accelerates from 36 mph (Miles per hour) to 200 mph and then decelerated to 24 mph. your tasks for this question are,
- Calculate the velocity at time 𝑡₁ and 𝑡₂ in m/s, km/h, and mph. Individual 𝑡₁ and 𝑡₂ are provided for each student in the attached file
- Bring evidence from the video to show the accuracy of your calculation. For example, the calculated velocity at 𝑡 = 62 (𝑠) is 29.3 mph. The actual velocity based on the following figure is 24 which is close to the calculated velocity
- Compare your calculated velocities with the actual velocities of the car and calculate their differences in percent.
- Explain the reasons for discrepancies between calculated and actual velocities.
Do You Need Assignment of This Question
Searching for essay writing services UK? We have you covered! Through our expert essay writers, Students Assignment Help UK offers unique essay services UK with zero plagiarism. With their collaborative approach and offering custom essay help, you can be sure to get a quality essay written with the help of professionals. That way, your essay will have all the details needed to make it stand out in the eyes of your professor. So why wait? Contact us today!
Answer


