- ENGE2003 Engineering Project Management Coursework 2, 2026 | DMU
- 55-500223 Analogue and Digital Electronic Design Coursework Brief 2026 | SHU
- EGR9017 Power Systems Assessment Coursework 1 Brief 2026 | University of Lincoln
- 7BIOM037W Systems Biology Coursework 1 Report 2026 | University of Westminster
- NCFE CACHE Level 3 Unit 8 Professional Practice Portfolio 1 Coursework 2026
- NCFE CACHE Level 3 Unit 9 Supporting Emergent literacy Coursework 2026
- 6WBS0035/ 6WBS0036 Digital Economy CW1 Assignment Brief 2026 | UOH
- DSM060 Data Science Research Topics Coursework Assignment 2026 | UOL
- BARC0087 Structures Materials & Forming Techniques Coursework 2026 | UCL
- LL5306 Commercial Law Assessment Coursework Brief 2026 | Kingston University
- M22319 / M33098 Numerical Skills & Economics Assessment Coursework | UOP
- BMG872 Global Strategy Development and Implementation Individual Assignment CWK Brief 2026
- LLB020N204A Law of Property Assessment Coursework Brief 2026
- BS3397 Microeconometrics Coursework Assignment Brief 2026 | AU
- UMAD47-15-M Managing Finance Assessment Coursework Brief | UWE
- BST851 Business Data Analytics Assessment Coursework 2026
- MMM143 International Business and the World Economy Coursework 2026
- EMS402U Engineering Design Coursework Project Report 2026 | QMUL
- 25BSC565 Fundamentals of Strategic Management Coursework Brief
- MARK5025 Contemporary Marketing Communications Assessment Coursework Brief 2
AM41PB: Bayesian approach – The Pareto distribution is a power-law-like probability distribution that describes the distribution of wealth in a society: Probabilistic Modelling Coursework, UOM, UK
| University | University of Milan (UOM) |
| Subject | AM41PB: Probabilistic Modelling |
- Bayesian approach – The Pareto distribution is a power-law-like probability distribution that describes the distribution of wealth in a society, fitting the trend that a large portion of wealth is held by a small fraction of the population. It takes the form
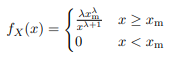
where it provides the probability of x above a threshold Xm ≥ 0
On BlackBoard, under the section assignments, please find a dataset income distribution by percentile of the UK population for the tax years 2010-11 to 2018-9. Use the last digit of your student number to choose the tax year you will be working on (0 → 2010 − 11, 1 → 2011 − 2, . . . , 8, 9 → 2018 − 9).
- Show that the Pareto distribution is indeed a probability distribution.
- Plot the data as the percentage of the population (y-axis) with income above certain values (x-axis); to simplify the presentation present the income in thousands of pounds.
- Assuming the data is i.i.d. and represented by the Pareto distribution, find the maximum likelihood expression for the parameter λML. Obtain the numerical value of λML given data D and Xm = £15, 000. Specify the data you are working with and the number of data points used.
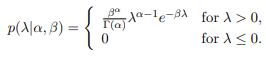
- For data set D = {x1, . . . , xN }, show that the Gamma probability distribution function


is the conjugate prior for the Pareto distribution? Derive the corresponding posterior p(λ|D). - Assuming the data is represented by the Pareto distribution, find the Maximum A Posteriori expression of the parameter λMAP. Use the prior values α = 1 and β = 1 to obtain the numerical value of λMAP given data D.
- Use the values obtained for the parameters λML and λMAP to compare the estimated percentage of the population with income above £20, 000.
- Decision theory- Large Diamonds (D) are exponentially rare and their weight follows the exponential distribution
![]()
where g is the weight of a diamond in grams and λD is a constant. In the same mine, there are also White Sapphire (WS) crystals that look like diamonds but are very regular in weight, following a Gaussian distribution.
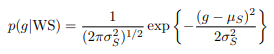
of mean µS and variance σ, 2 S. The average size of diamonds λD is much smaller than that of White Sapphire λD << µS. Additionally, diamonds are much rarer, so p(WS) << p(D).
The mine owner wants to automate the sorting of Diamonds vs White Sapphire by weight, setting a threshold weight gT.
- Write an expression for the misclassification error of Diamonds as White Sapphire p(D|WS) and of White Sapphire as Diamonds p(WS|D) as functions of the threshold weight gT.
- Minimize the total misclassification error with respect to the threshold weight gT. What is the expression obtained for gT.
- Calculate the value of gT for the parameters λD = 1, µS = 5, σ2 S = 1 and prior probabilities p(WS) = 0.8 and p(D) = 0.2. Sketch the two distributions, point to the threshold value gT and to the area that contributes to the misclassification error of Diamonds as White Sapphire.
- The mine is losing money and the owner realizes that he has not taken into account that large diamonds are exponentially more expensive and the misclassification cost p(WS|D) with respect to p(D|WS) (which for simplicity we will attribute cost 1 to) is

Assume λC < λD. Find the threshold weight gT expression in this case (not numerical value).
Buy Answer of This Assessment & Raise Your Grades
Answer


