You are being asked to create graphs, perform calculations, and analyze the graphs based on the lecture material: Economics Assignment, UOC, UK
| University | University Of Cambridge (UOC) |
| Subject | Economics |
You are being asked to create graphs, perform calculations, and analyze the graphs based on the lecture material, as well as on relevant journal articles. Make sure that you label all graphs properly. Both the X and the two Y1 and Y2 axes should be labeled. There should be a legend showing each series on the graph. Your assignment output is a paper on a specific topic of your choice. Before you draft your paper, you need to do the nine preparatory tasks below:
- Formulate a testable hypothesis on how a certain economic institution affects macroeconomic outcomes, e.g., economic growth or income levels, inequality, consumption, or any other variable in which you are interested. Why do you think this hypothesis is interesting to look at?
- Pick a country or, preferably, a set of countries of your choice. It can be the country you were born in, or any other which attracts your interest or your own country among a larger group of similar countries.
- Justify your intuition. Explain why you think your hypothesis is correct in your country/countries of choice.
To do the explanation properly, you need to consult the economic literature and summarize it. For example:
- if your hypothesis is that improvement in property rights raises living standards, then you need to do a literature search on ‘property rights and ‘economic growth and/or ‘living standards.’
- If your statement is that corruption reduces living standards, you need to search for ‘corruption’ and ‘living standards in the scientific literature databases containing the keywords used to start your literature search.
- Download data on the macroeconomic indicator you chose about your country/countries from the World Development Indicators. To ensure comparability of the data over time, you need to use real rather than nominal values for GDP, GDP per capita, income, consumption, and anything which has been calculated by multiplying a quantity with a price. Let us call this your Y variable.
- Download data on the institutional indicator you would like to correlate with your main macroeconomic indicator. WDI contains many of them but if not, then use other databases, e.g., Economic Freedom of the World indices, Heritage Foundation indices, Polity IV. Let us call this your X variable.
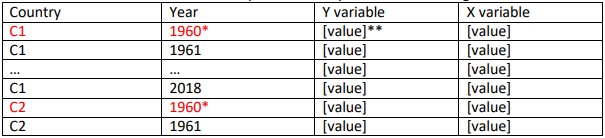
- Merge the data sets on your Y and X variables. Merging data sets means you need to have both Y and X for the same country in the same year in the following format:

* Note: 1960 is just an example. It can be any year you have data coverage for.
** Note: Your actual values will not be in brackets, they will be numbers. Consider using natural logarithms of monetary values.
The data above is what we call tidy data: columns represent variables, rows represent observations, and you typically have a match between X and Y variables on certain identifiers. In this case, the identifier is a country-year: each country-year is being observed once in X, and once in Y. In other words, we have a unique observation for each country each year. It is OK if some of the country years are missing. The data will just have a missing observation for that country-year and will not include it in any results. Please DO NOT replace any missing observation with a zero.
Describe the data and your data sources. You do not need to attach the above table to your paper, just describe your X and Y, how many observations for each, any significant years in which your X has changed its value - Perform a graphical analysis of the correlation between Y and X. As the scale of Y and X is likely to be quite different, you will need to plot Y and X on two separate Y-axes. Plot Year on your horizontal axis. Pay particular attention to how your Y variable changes around turning points in your X, i.e., around your
institutional reforms. Based on your graphical observation, is your hypothesis confirmed or rejected? Refer to the economic literature you have read and discuss why you think it was confirmed/rejected. - Are there better ways to evaluate your hypothesis? If yes, describe them. Test your hypothesis by using simple bivariate regression analysis in MS Excel or any other software. A conventional way to do regression analysis is in STATA or R. For doing regression in MS Excel, search how to do a regression in Excel.
- Conclude in a few sentences: What was your question? What was your hypothesis? What did you do to test it? Did you find evidence in favor of your hypothesis? What is the importance of this evidence?
Do You Need Assignment of This Question
buy online assignment writing services UK if you want to do your assignment papers quickly and cheaply. Whether ask us for help to do my assignment or any case study project, we will assist you to write 100% plagiarism-free answers on economic assignments at an effective price.


