- DSM060 Data Science Research Topics Coursework Assignment 2026 | UOL
- BARC0087 Structures Materials & Forming Techniques Coursework 2026 | UCL
- LL5306 Commercial Law Assessment Coursework Brief 2026 | Kingston University
- M22319 / M33098 Numerical Skills & Economics Assessment Coursework | UOP
- BMG872 Global Strategy Development and Implementation Individual Assignment CWK Brief 2026
- LLB020N204A Law of Property Assessment Coursework Brief 2026
- BS3397 Microeconometrics Coursework Assignment Brief 2026 | AU
- UMAD47-15-M Managing Finance Assessment Coursework Brief | UWE
- BST851 Business Data Analytics Assessment Coursework 2026
- MMM143 International Business and the World Economy Coursework 2026
- EMS402U Engineering Design Coursework Project Report 2026 | QMUL
- 25BSC565 Fundamentals of Strategic Management Coursework Brief
- MARK5025 Contemporary Marketing Communications Assessment Coursework Brief 2
- GEEN1127 Design and Materials Individual Coursework Brief 2025-2026 | UOG
- BPS319 PBL 3 Natural Product Chemistry vs Kinetic Isotope Effects Coursework | UOL
- LD7098 Cyber Security Principles Coursework Assessment 2025-26 | Northumbria University
- EG7004 Soil Structure Engineering Assignment 1 Coursework Semester A 2025/26 | University of East London (UOEL)
- BSC127 Information and Knowledge Management Individual Coursework | Loughborough University
- CI5250 Computing Systems Assignment – Networking Design Coursework | Kingston University
- Critical Literature Review Assignment 001 Coursework | Harvard University
ECN5007: A researcher is investigating the relationships between house prices in UK regions. They have quarterly data on the log: Applied Econometrics Course Work, UOO, UK
| University | University of Oslo (UOO) |
| Subject | ECN5007: Applied Econometrics |
Question
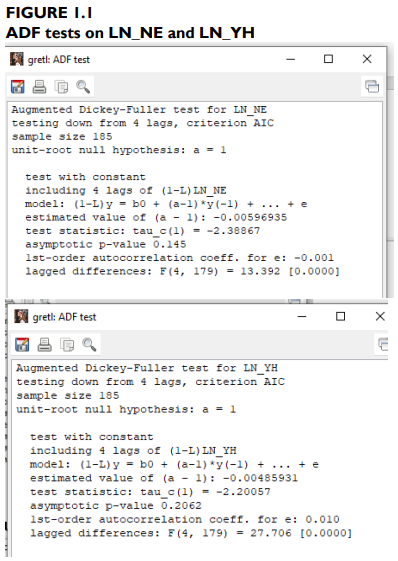
A researcher is investigating the relationships between house prices in UK regions. They have quarterly data on the log of the index of house prices from 1973 Q3 to 2021 Q1 for two adjacent UK regions – the North East (LN_NE) and Yorkshire and Humberside (LN_YH).
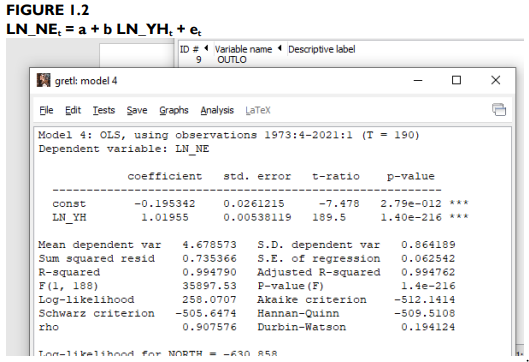
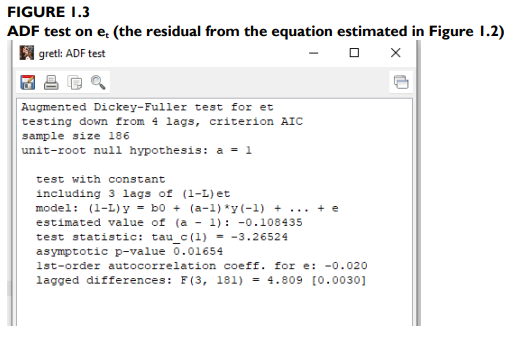
- The researcher has produced the output, shown in FIGURES 1.1, 1.2, and 1.3 below. The researcher is unsure as to whether the regression model presented in Figure 1.2 represents a spurious regression or whether it has some more meaningful interpretation. Advise the researcher on how to interpret the regression in Figure 1.2, explaining how you arrive at your conclusions from the available evidence shown in Figures 1.1, 1.2, and 1.3. Explain how this result has some degree of ‘economic rationale’.
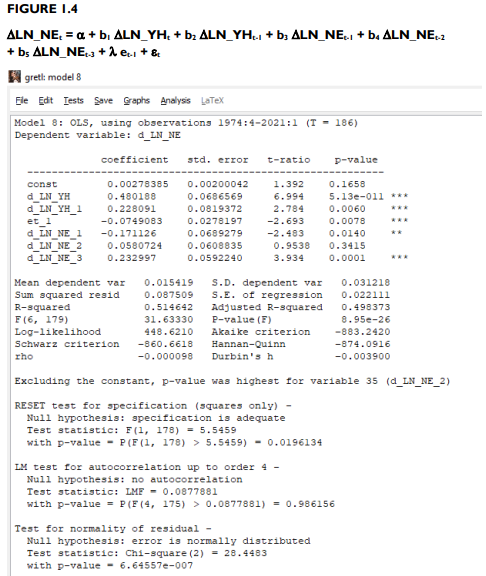
- The researcher has also produced the output shown in Figure 1.4. Explain and interpret the output shown in Figure 1.4.
Do You Need Assignment of This Question
Buy Answer of This Assessment & Raise Your Grades
Struggling with your ECN5007: Applied Econometrics coursework? Don’t worry, Students Assignment Help UK is here to lend a helping hand. Our team of skilled econometrics experts can assist you in understanding and applying econometric methods, such as time series analysis, panel data analysis, and hypothesis testing. So, get the best coursework writing assistance at a low price.
Answer


